Create More Engaging Annual Reports for Your Audience
Our Annual Reports Sure Clean Up Nice
At Shields SGF it’s always annual report season! January reports, March reports, June reports, we’ve done them all. No matter where it hits on the calendar, we're ready to help our clients share their yearly stories through both print and digital publishing. In fact, creating annual reports is the bread and butter of our publication projects and a great way to build relationships with our clients year after year.
Each annual report brings a story of wins, challenges and future opportunities for our clients. Each one is unique, with some taking dramatically different forms to best tell their narrative. For some it’s all about financial statements, for others it’s a collection of articles about their different ventures. Sometimes key donors need to be highlighted, sometimes there’s research and data from the year that needs to be presented in a clear and concise way. No matter what tale your organization aims to tell, Shields SGF will help showcase it in a way that’s digestible to stakeholders, employees, and the public.
In recent years, we’ve expanded far beyond the standard PDF or printed booklet...here’s three of our clients who have jumped headfirst into the interactive annual report space and have found great success.
CEE - Consortium for Energy Efficiency

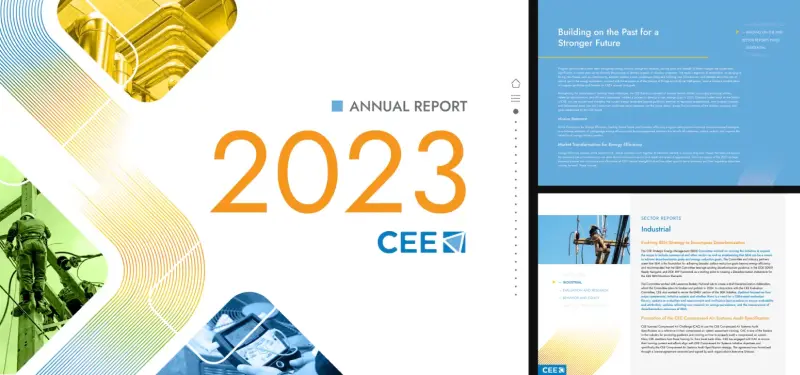
Shields SGF has worked with CEE (The Consortium for Energy Efficiency) to build a new website as well as branding & designing print material for their ongoing Integrated Home Competition. We were a natural partner to help create a unique and interactive annual report for them in 2023.
During one of our regular client meetings with them, we learned CEE wanted a more immersive way to bring the story of their organization to life. The report we created for them brings the user through three highlight articles that tell the key messages of the year, then includes smaller reports from each of the sector departments within CEE. Included also is a leadership message, membership listings, infographics and financial statements.
CEE saw success with this format and revisited it in 2024 with some aesthetic changes. Luckily, with the web architecture already in place, it was easy to update the stories and graphics to give the piece a yearly refresh without having to start from square one.
IFOPA - International Fibrodysplasia Ossificans Progressiva Association

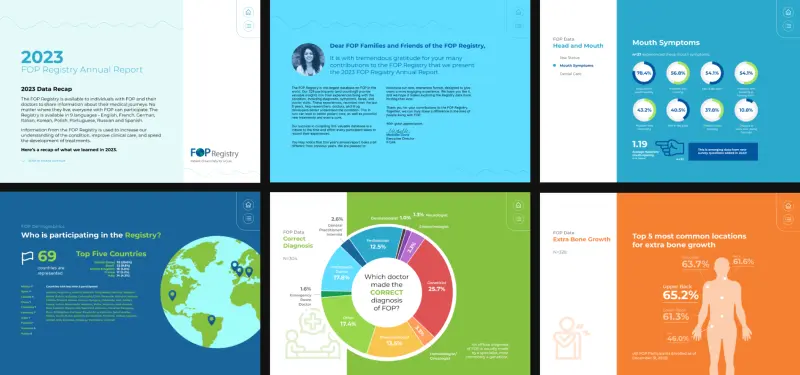
A resource and advocacy group for patients with FOP, a rare genetic disease, IFOPA has relied on us for their annual reports since 2019. Previously, they wanted to share their annual data in the form of long-scroll static infographics. We helped bring these to life, but knowing the limits of the medium, we proposed a different solution this year. An interactive report could be just as colorful and chock-full of data, but it would also be more accessible and would give the content room to breathe.
This year’s IFOPA annual report features animating charts that provide more insight into the
data, links to publications where readers can learn more, a message from the executive director
and a way to highlight sponsors of the organization. We also built a landing page for past and
present FOP reports so that patients and researchers can access one hub for this information
and see how the data has evolved over time. Future reports, both static and interactive, now
have a place to live online!
CHIA - Center for Health Information and Analysis

The Center for Health Information and Analysis (CHIA) relies on us to help publish a 120+ page report on the status of Massachusetts' healthcare spending each year. Shields SGF has worked to bring this report to life every year since 2018. While this information is highly technical, the charts and graphs involved attempt to make the data as digestible as possible to policy makers and industry analysts.
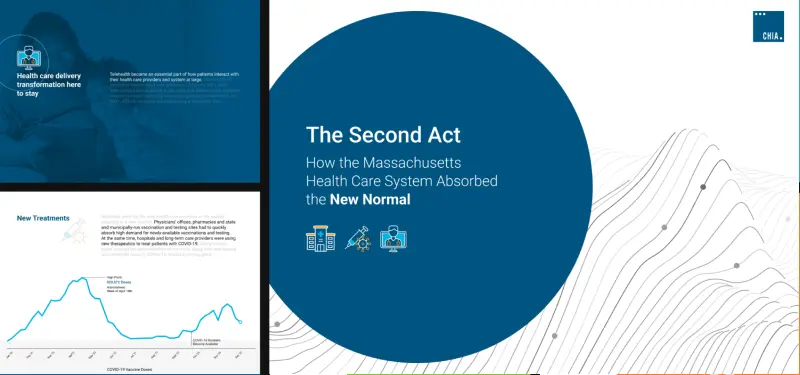
In 2023, CHIA reached out to us for help developing a companion interactive piece to accompany their full report. Rather than tackle all of the data that they aggregate each year, this interactive piece covers just one key interest story they wish to highlight. In 2023, that was The Second Act: The Massachusetts Health Care System Charts a New Normal, and in 2024 it was Drivers of Commercial Prescription Drug Spending: Cost or Utilization?.
Both these pieces use animation and data visualization to tell a story. As a user scrolls, charts move and recalibrate to illustrate the narrative being told. Users are able to click through to sources and the main CHIA report to learn more. All of these elements combine to create a cohesive and succinct presentation of the data CHIA has gathered.

